Lesson 1
Introduction to Data Analysis
In this lesson, we will introduce you to data analysis and what we will be covering in this course.

Course
This course establishes a framework for data analytics as a series of progressive steps starting with the data source and ending with the interpretation of results. We introduce fundamental concepts such as data analytics life cycle, data integrity, and the four types of data analytics (descriptive, diagnostic, predictive, and prescriptive). Students who complete this course will be equipped with the skills to identify the data analytics strategy used in a given situation and where they are in the data analytics life cycle.
This course establishes a framework for data analytics as a series of progressive steps starting with the data source and ending with the interpretation of results. We introduce fundamental concepts such as data analytics life cycle, data integrity, and the four types of data analytics (descriptive, diagnostic, predictive, and prescriptive). Students who complete this course will be equipped with the skills to identify the data analytics strategy used in a given situation and where they are in the data analytics life cycle.
Beginner
4 weeks
Real-world Projects
Completion Certificate
Last Updated May 20, 2024
Lesson 1
In this lesson, we will introduce you to data analysis and what we will be covering in this course.
Lesson 2
In this lesson, we will learn how to solve data analysis issues using each step of the data analytics life cycle.
Lesson 3
In this lesson, we will review the importance of data integrity in data analysis, the components of data integrity, and how to identify and fix it.
Lesson 4
In this lesson, we will review each of the different types of data analytics and when to use them, along with statistics that pertain to each analytics type.
Lesson 5
In this lesson, we will introduce Power BI and its capabilities as an analytics and data visualization tool.
Lesson 6 • Project
In this project, you will use what you learned about data analytics to analyze KPIs for a company and represent your analysis with effective visuals.
Lesson 7
In this lesson, you'll learn how to set up a Windows desktop workspace to use Power BI

Sr. Analyst, Reporting & Insights
Ivan Vega is a Senior Analyst, Reporting & Insights at T-Mobile. On evenings and weekends, he teaches both SQL and data visualization courses for master's programs at St. Mary's College of California. He has been teaching for over 2 years and has been an analyst for over 8 years.
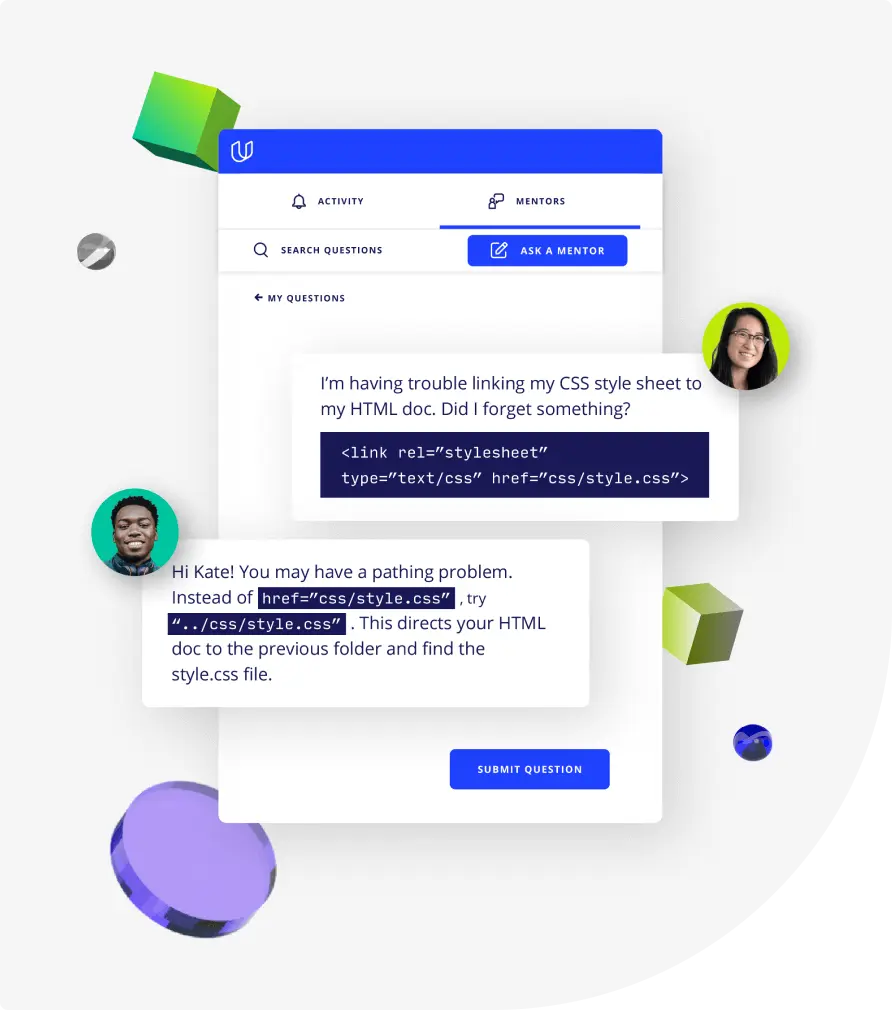
Combine technology training for employees with industry experts, mentors, and projects, for critical thinking that pushes innovation. Our proven upskilling system goes after success—relentlessly.
Demonstrate proficiency with practical projects
Projects are based on real-world scenarios and challenges, allowing you to apply the skills you learn to practical situations, while giving you real hands-on experience.
Gain proven experience
Retain knowledge longer
Apply new skills immediately
Top-tier services to ensure learner success
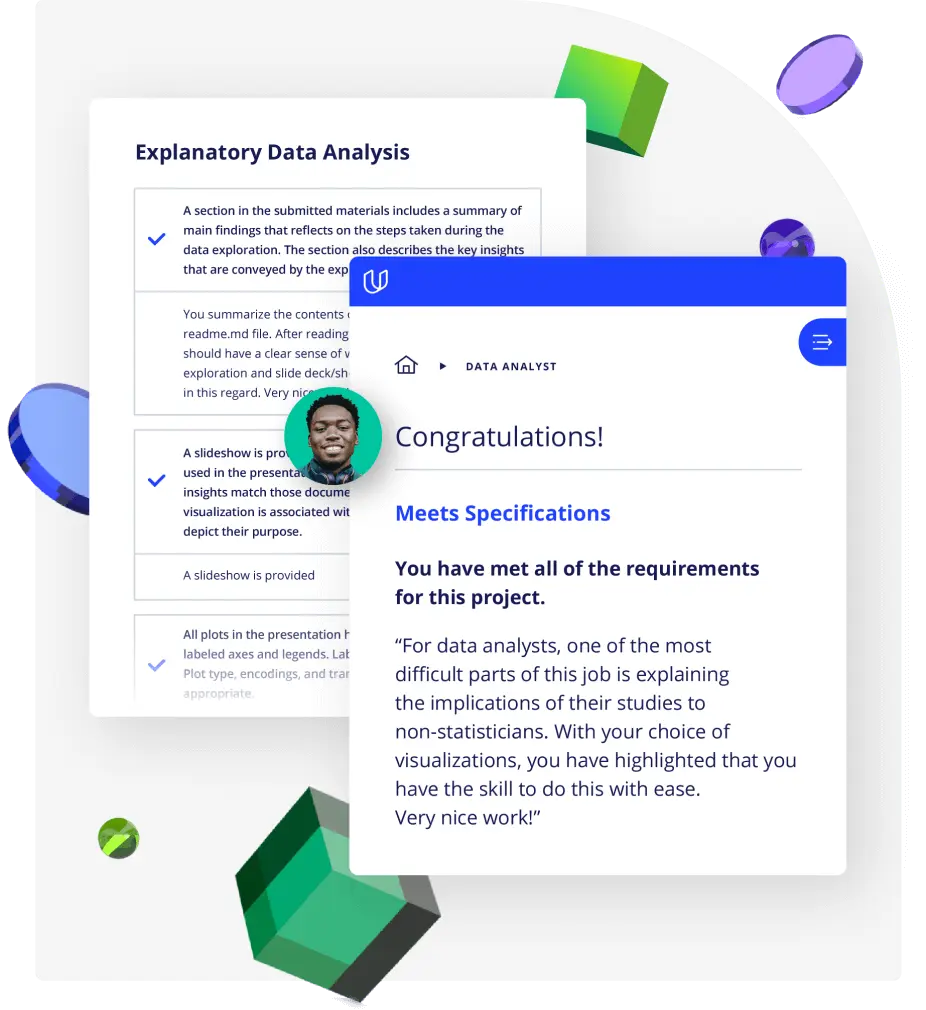
Reviewers provide timely and constructive feedback on your project submissions, highlighting areas of improvement and offering practical tips to enhance your work.
Get help from subject matter experts
Learn industry best practices
Gain valuable insights and improve your skills

Unlimited access to our top-rated courses
Real-world projects
Personalized project reviews
Program certificates
Proven career outcomes
Full Catalog Access
One subscription opens up this course and our entire catalog of projects and skills.
Average time to complete a Nanodegree program
4 weeks
, Beginner
3 weeks
, Beginner
3 weeks
, Advanced
3 months
, Beginner
(1194)
2 months
, Beginner
3 months
, Beginner
4 weeks
, Beginner
3 weeks
, Beginner
(88)
3 months
, Beginner
4 weeks
, Beginner
3 weeks
, Intermediate
4 weeks
, Beginner
4 weeks
, Intermediate
4 weeks
, Beginner
4 weeks
, Beginner
(124)
5 months
, Beginner
4 weeks
, Beginner
3 weeks
, Beginner
3 weeks
, Advanced
3 months
, Beginner
(1194)
2 months
, Beginner
3 months
, Beginner
4 weeks
, Beginner
3 weeks
, Beginner
(88)
3 months
, Beginner
4 weeks
, Beginner
3 weeks
, Intermediate
4 weeks
, Beginner
4 weeks
, Intermediate
4 weeks
, Beginner
4 weeks
, Beginner
(124)
5 months
, Beginner

Introduction to Data Analytics
4 weeks
, Beginner
3 weeks
, Beginner
3 weeks
, Advanced
3 months
, Beginner
(1194)
2 months
, Beginner
3 months
, Beginner
4 weeks
, Beginner
3 weeks
, Beginner
(88)
3 months
, Beginner
4 weeks
, Beginner
3 weeks
, Intermediate
4 weeks
, Beginner
4 weeks
, Intermediate
4 weeks
, Beginner
4 weeks
, Beginner
(124)
5 months
, Beginner
4 weeks
, Beginner
3 weeks
, Beginner
3 weeks
, Advanced
3 months
, Beginner
(1194)
2 months
, Beginner
3 months
, Beginner
4 weeks
, Beginner
3 weeks
, Beginner
(88)
3 months
, Beginner
4 weeks
, Beginner
3 weeks
, Intermediate
4 weeks
, Beginner
4 weeks
, Intermediate
4 weeks
, Beginner
4 weeks
, Beginner
(124)
5 months
, Beginner