Lesson 1
Welcome to Creating Visualizations with Power BI
This lesson will just quickly make sure you've covered everything you need to know and then we'll introduce the topic of data visualization and why it's important.

Course
In this course, students will learn how to carry Power BI beyond mere bar charts and transform their reports into data exploration & storytelling tools that companies can use to better understand their data.
In this course, students will learn how to carry Power BI beyond mere bar charts and transform their reports into data exploration & storytelling tools that companies can use to better understand their data.
Beginner
4 weeks
Real-world Projects
Completion Certificate
Last Updated March 25, 2024
Lesson 1
This lesson will just quickly make sure you've covered everything you need to know and then we'll introduce the topic of data visualization and why it's important.
Lesson 2
In this lesson, we're going to kick things off with an overview of common data visualizations you will use in Power BI such as bar charts, line charts, and advanced visuals like scatter plot and maps.
Lesson 3
In this lesson, we're going to discuss useful design principles that can help those data visuals really shine.
Lesson 4
In this lesson, we'll talk about tools like filters and slicers that will help your users explore data by searching for specific items that interest them.
Lesson 5
In this lesson, we are going to explore a couple of advanced Power BI features that will tie our previous lessons together and test all the skills you have learned up to this point.
Lesson 6 • Project
In this project, you will design and build a Power BI report for Waggle, a start-up company that builds smart devices and apps that help pet owners monitor the health of their pets.

Senior Business Intelligence Engineer at Humana
Sean is a Senior Business Intelligence Engineer at Humana, where he oversees an enterprise community of thousands of users & developers. His Power BI work has been featured recently at the Microsoft Business Applications Summit and on Microsoft Mechanics.
Combine technology training for employees with industry experts, mentors, and projects, for critical thinking that pushes innovation. Our proven upskilling system goes after success—relentlessly.
Demonstrate proficiency with practical projects
Projects are based on real-world scenarios and challenges, allowing you to apply the skills you learn to practical situations, while giving you real hands-on experience.
Gain proven experience
Retain knowledge longer
Apply new skills immediately
Top-tier services to ensure learner success
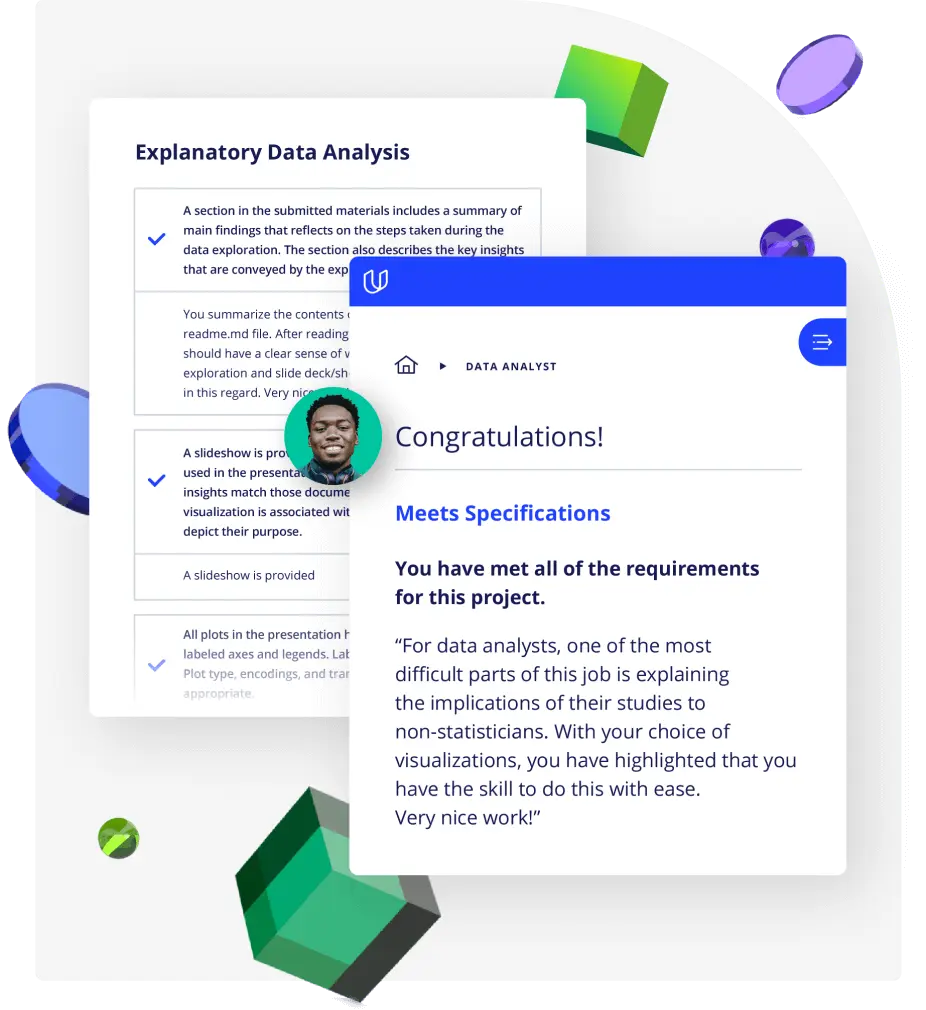
Reviewers provide timely and constructive feedback on your project submissions, highlighting areas of improvement and offering practical tips to enhance your work.
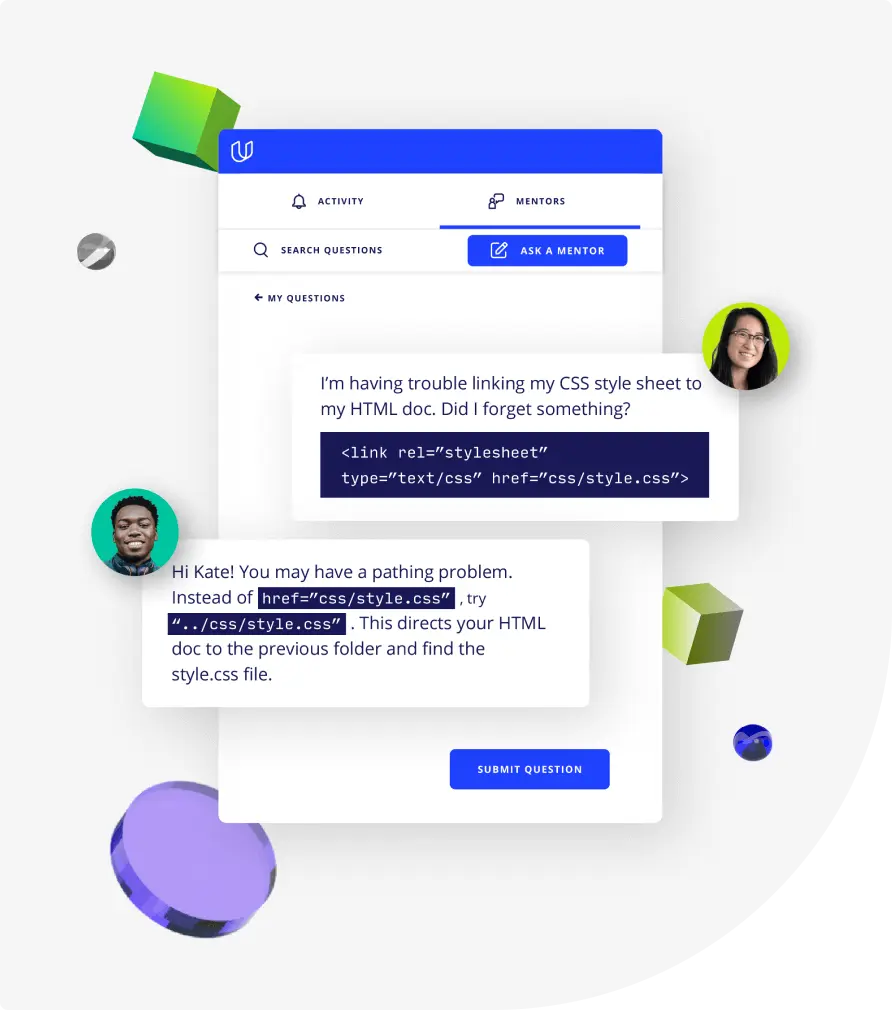
Get help from subject matter experts
Learn industry best practices
Gain valuable insights and improve your skills

Unlimited access to our top-rated courses
Real-world projects
Personalized project reviews
Program certificates
Proven career outcomes
Full Catalog Access
One subscription opens up this course and our entire catalog of projects and skills.
Average time to complete a Nanodegree program
4 weeks
, Beginner
4 weeks
, Beginner
(88)
3 months
, Beginner
4 weeks
, Beginner
4 weeks
, Beginner
4 weeks
, Beginner
3 months
, Beginner
4 weeks
, Beginner
(124)
5 months
, Beginner
3 weeks
, Beginner
(1194)
2 months
, Beginner
3 weeks
, Advanced
1 week
, Beginner
4 weeks
, Beginner
6 hours
, Fluency
1 hour
, Discovery
4 weeks
, Beginner
4 weeks
, Beginner
(88)
3 months
, Beginner
4 weeks
, Beginner
4 weeks
, Beginner
4 weeks
, Beginner
3 months
, Beginner
4 weeks
, Beginner
(124)
5 months
, Beginner
3 weeks
, Beginner
(1194)
2 months
, Beginner
3 weeks
, Advanced
1 week
, Beginner
4 weeks
, Beginner
6 hours
, Fluency
1 hour
, Discovery

Creating Visualizations with Power BI
4 weeks
, Beginner
4 weeks
, Beginner
(88)
3 months
, Beginner
4 weeks
, Beginner
4 weeks
, Beginner
4 weeks
, Beginner
3 months
, Beginner
4 weeks
, Beginner
(124)
5 months
, Beginner
3 weeks
, Beginner
(1194)
2 months
, Beginner
3 weeks
, Advanced
1 week
, Beginner
4 weeks
, Beginner
6 hours
, Fluency
1 hour
, Discovery
4 weeks
, Beginner
4 weeks
, Beginner
(88)
3 months
, Beginner
4 weeks
, Beginner
4 weeks
, Beginner
4 weeks
, Beginner
3 months
, Beginner
4 weeks
, Beginner
(124)
5 months
, Beginner
3 weeks
, Beginner
(1194)
2 months
, Beginner
3 weeks
, Advanced
1 week
, Beginner
4 weeks
, Beginner
6 hours
, Fluency
1 hour
, Discovery