Lesson 1
Welcome to Advanced Data Storytelling
In this welcome lesson, you will meet your instructor and learn about the pre-requisite skills of this course. You will also have an overview of the topics covered in this course.

Course
In this course, you’ll learn advanced data visualization and storytelling techniques. You will learn about the various types of data stories and how to find and use them effectively. You’ll learn to use Tableau Storypoint to add interactivity and other visual elements to a story. Then you’ll learn to add animation and narration to your analyses with both Tableau Pages and Flourish.
In this course, you’ll learn advanced data visualization and storytelling techniques. You will learn about the various types of data stories and how to find and use them effectively. You’ll learn to use Tableau Storypoint to add interactivity and other visual elements to a story. Then you’ll learn to add animation and narration to your analyses with both Tableau Pages and Flourish.
Beginner
2 months
Real-world Projects
Completion Certificate
Last Updated June 16, 2023
Lesson 1
In this welcome lesson, you will meet your instructor and learn about the pre-requisite skills of this course. You will also have an overview of the topics covered in this course.
Lesson 2
You learn about sequential data stories, and how eight different story types can be used to find and tell interesting data stories.
Lesson 3
You will learn how to tell interactive stories by creating stories in Tableau. You will learn how to add a Hans Rosling bubble chart to Tableau and how to create a Tableau Storypoint Workbook.
Lesson 4 • Project
In this lesson, you will apply the skills you have acquired in this course to use the World Bank Indicators data file to create an interactive Tableau Story.
Lesson 5
You will use datasets for animating data and build out animations with Tableau pages and get introduced to Flourish.
Lesson 6
You will learn how to add audio and narration to your data stories using Flourish, including setting up the files, charts, animation, and audio files to create interactive stories.
Lesson 7 • Project
In this lesson, students will create an animated data story and add an audio track to create a narrated Flourish story that they can add to their portfolio.

CEO of DataLiteracy.com
Ben Jones is the founder & CEO of Data Literacy, LLC, a training company that helps people learn the language of data. Ben teaches data visualization theory at the University of Washington, and he's the author of Communicating Data With Tableau (O'Reilly 2014).
Combine technology training for employees with industry experts, mentors, and projects, for critical thinking that pushes innovation. Our proven upskilling system goes after success—relentlessly.
Demonstrate proficiency with practical projects
Projects are based on real-world scenarios and challenges, allowing you to apply the skills you learn to practical situations, while giving you real hands-on experience.
Gain proven experience
Retain knowledge longer
Apply new skills immediately
Top-tier services to ensure learner success
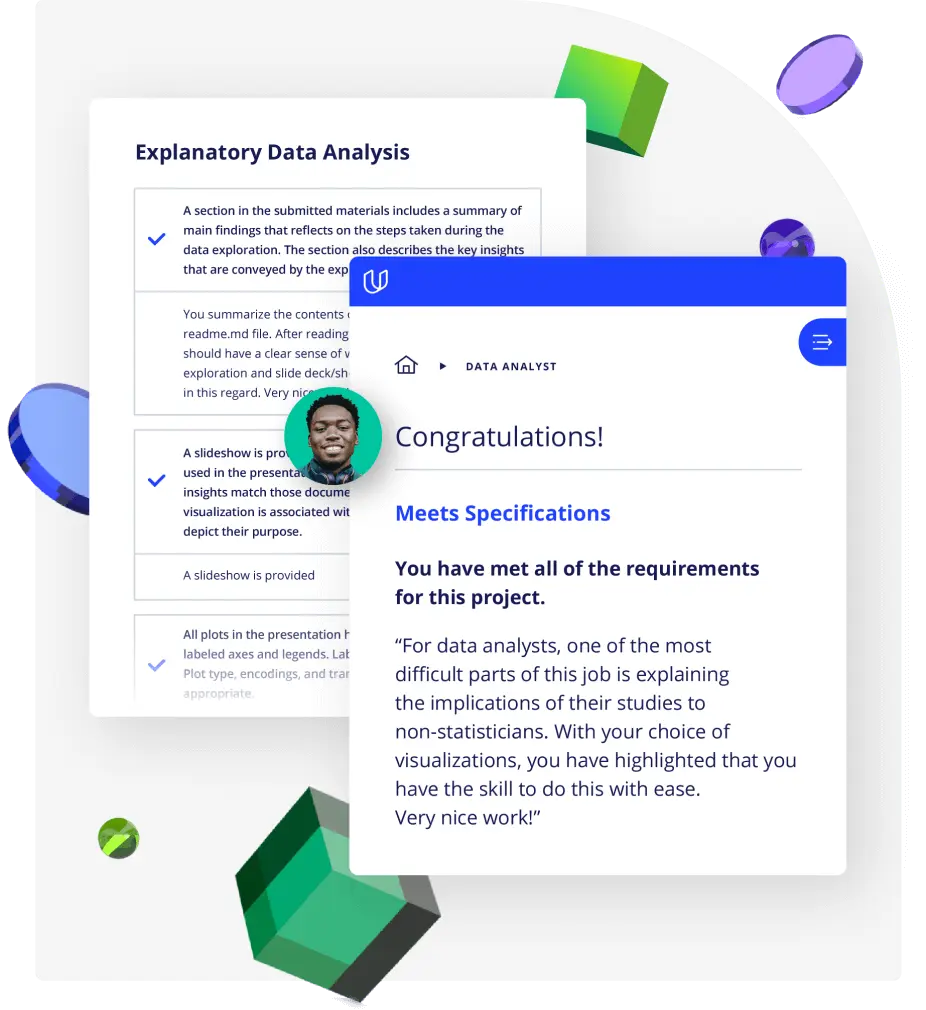
Reviewers provide timely and constructive feedback on your project submissions, highlighting areas of improvement and offering practical tips to enhance your work.
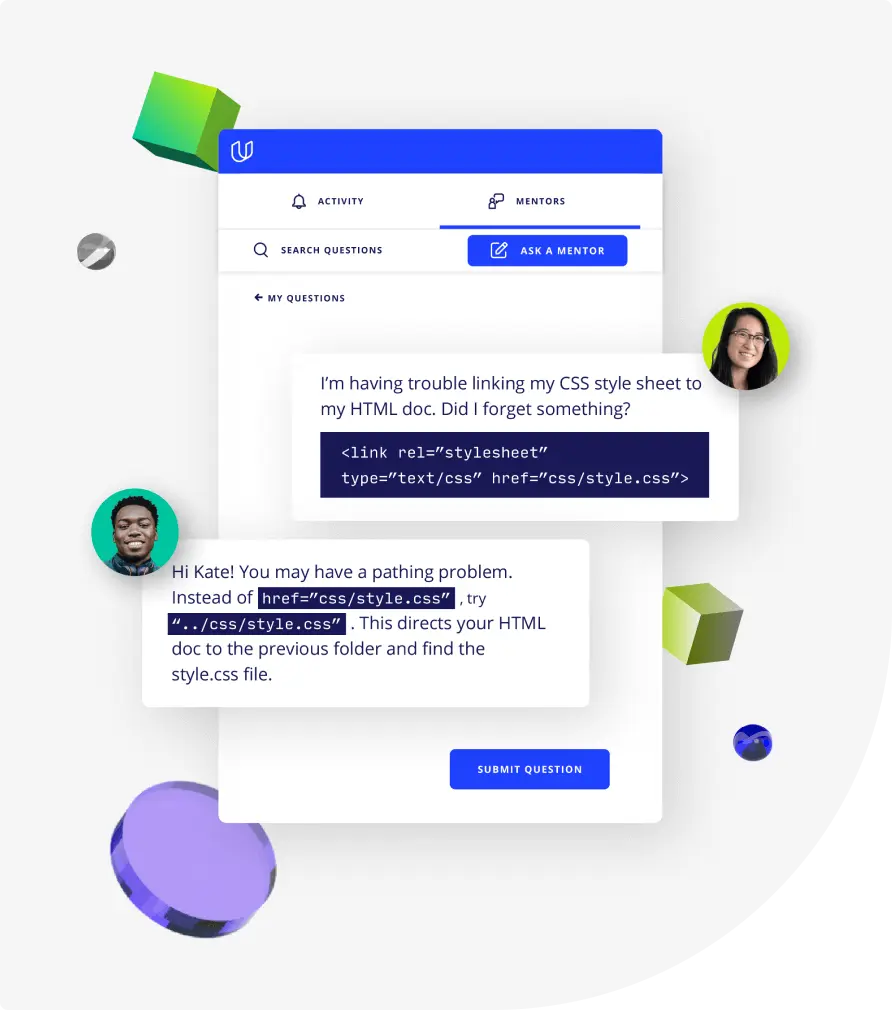
Get help from subject matter experts
Learn industry best practices
Gain valuable insights and improve your skills

Unlimited access to our top-rated courses
Real-world projects
Personalized project reviews
Program certificates
Proven career outcomes
Full Catalog Access
One subscription opens up this course and our entire catalog of projects and skills.
Average time to complete a Nanodegree program
1 month
, Beginner
1 week
, Beginner
(124)
5 months
, Beginner
1 hour
, Discovery
4 weeks
, Intermediate
3 weeks
, Advanced
4 weeks
, Beginner
3 weeks
, Beginner
1 hour
, Discovery
4 hours
, Beginner
4 weeks
, Beginner
5 hours
, Fluency
4 weeks
, Beginner
1 hour
, Discovery
(88)
3 months
, Beginner
3 months
, Beginner

Advanced Data Storytelling
1 month
, Beginner
1 week
, Beginner
(124)
5 months
, Beginner
1 hour
, Discovery
4 weeks
, Intermediate
3 weeks
, Advanced
4 weeks
, Beginner
3 weeks
, Beginner
1 hour
, Discovery
4 hours
, Beginner
4 weeks
, Beginner
5 hours
, Fluency
4 weeks
, Beginner
1 hour
, Discovery
(88)
3 months
, Beginner
3 months
, Beginner